
Getting Started with n8n: Simple Automations for Beginners
Website Uptime Monitoring with Alert Notifications: A Step-by-Step Guide

Hey everyone! I’m kicking off a series on all the awesome things you can do with n8n, even if you’re a complete beginner.
What is n8n?
It’s a powerful workflow automation tool that connects different apps, services, and databases to handle tasks for you - without writing a single line of code.
Think of it like a personal automation assistant that takes care of repetitive work so you can focus on what really matters.
This is just the beginning! We’ll start with the basics, building simple automations step by step, and gradually move into more advanced workflows.
No tech skills needed!
Got something specific you want to automate? Drop a comment and let me know what you’d like to see next!
Today, I'm excited to show you how to build a Website Uptime Monitoring workflow with n8n. I have a workflow like this for every website that I manage.
We'll set up an automation that checks your website's status every hour and sends out an alert if something goes wrong. Let’s jump right in!
This guide covers:
An introduction to the n8n UI.
How to set up a Schedule trigger to run the workflow periodically.
Configuring an HTTP Request node to check your website.
Adding logic to decide if an alert should be sent.
Setting up a notification node.
Testing the workflow and going live.
n8n UI Overview
You can follow along using n8n either on their platform (they offer a very generous trial) or by self-hosting it. If you're interested in setting up n8n on your own server, check out the step-by-step guide here:

Cool. Once you are logged in you will be greeted with a screen like this:

This is the n8n dashboard, the central place where you’ll manage all your workflows, credentials, and executions.
Breaking it down:
Workflows Tab (Highlighted) - This is where all your automation workflows live. Right now, it's empty because we haven’t created any yet.
Credentials Tab - This is where you store authentication details for third-party apps and services you connect to.
Executions Tab - This keeps track of past workflow runs, showing their status and any errors that occurred.
At the center, you’re greeted with:
👉 "Start from scratch" - Clicking this lets you build a new workflow from the ground up.
👉 "Create Workflow" Button (Top Right) - Another way to start a new automation, with extra options if needed.
Since we’re just getting started, click "Start from scratch" to begin creating your first workflow!
The n8n Workflow Editor

Now that you've started a new workflow, you’re looking at the n8n Editor – the blank canvas where you’ll build automations step by step.
For now, ignore the left sidebar - we’ll get to that in future tutorials. Let’s focus on what matters: the canvas and the controls you’ll be using.
Key Areas to Know:
The Canvas (Big Empty Space in the Center)
This is where you’ll create your automation by adding and connecting nodes (which are the building blocks of workflows). Right now, it’s empty - but not for long!"Add First Step" Button (Center of the Canvas)
Click this to add your first node - a small box representing a task in your automation (e.g., fetching data, sending an email, or triggering a webhook).Plus Button (Top Right Corner of the Canvas)
Another way to add nodes, if you prefer placing them manually. You can also use the TAB button to access it.Editor/Executions Toggle (Top Center)
You’re currently in the Editor view, where you build workflows. The Executions tab lets you monitor past runs to see what’s working and what needs fixing.Save Button (Top Right, in Red)
Hit this to save your progress. n8n won’t auto-save, so get used to clicking it!Active/Inactive Switch (Top Right)
Right now, the workflow is inactive, meaning it won’t run automatically. Once it’s complete, you can activate it to let it run in the background.
To navigate the canvas efficiently, use these controls:
Middle Mouse Click + Drag – Pan around the canvas smoothly.
Ctrl + Mouse Wheel – Zoom in and out quickly.
+and-Keys. Another way to zoom without using the mouse.
These make it easy to move around as your workflow grows. Give them a try!
Once you feel comfortable with the UI and navigating the canvas, give a name to your workflow by clicking the title in the top left. In the next Section we will start building the automation.
Creating the Workflow
To get started, click "Add First Step" to add a node. This will open a right sidebar with a list of available nodes. Since this is the first node in the workflow, the sidebar will only show trigger nodes – these are responsible for starting the automation.
Schedule Trigger node
For this tutorial, we’ll use the “Schedule Trigger” node. This node lets us run the workflow at set intervals, making it perfect for automations that need to run on a schedule.
Instead of scrolling through the list, you can use the input field at the top of the sidebar to quickly find the node you need. Type "schedule", and the Schedule Trigger node will appear.

When you click on Schedule Trigger, the node is added to the canvas, and the node settings screen opens. Every node in n8n has a settings screen where you configure its behavior.

For the Schedule Trigger node, you can set:
Trigger Interval – How often the workflow should run (e.g., every day, hour, or minute).
Days Between Triggers – If you choose "Days," you can set how many days should pass before it runs again.
Trigger at Hour & Minute – The exact time the workflow should start.
At the top, you'll see a "Test Step" button, which allows you to manually trigger the node to see how it works.
Once you're done configuring (I set mine to run every hour), click "Back to Canvas" (top left) to continue building your workflow!
You should be on this screen now.

HTTP Request Node
Now that the Schedule Trigger node is on the canvas, it’s time to add another node to define what happens when the workflow runs.
We’ll add an HTTP Request node to fetch data from a website or API. Here’s how:
Click the small plus (+) button on the right side of the Schedule Trigger node. This will make sure the new node is already connected to the previous node.
This will open the node selection sidebar.
In the search bar at the top, type "HTTP Request".
Click on the HTTP Request node to add it to the canvas.
This node allows us to make requests to external APIs or websites. Once added, we’ll configure it to visit our website of choice at the interval set by the Schedule Trigger.

Now that the HTTP Request node is added, it’s time to configure it to monitor a website.
In the URL field, enter the website you want to monitor (I used my website in this example) This is the site the automation will check regularly.
Leave the Method set to GET – this is used to fetch data from the website.
No authentication is needed for public websites, so keep Authentication set to None.
Once set up, this node will send a request to the specified website at the interval defined by the Schedule Trigger. Click "Back to Canvas" once you're done!

Right now, our workflow runs the HTTP Request node at scheduled intervals, but we want to take action only if the request fails (meaning the website is down or returning an error).
To do this, we need to filter the response and continue the workflow only when an error occurs.
There are multiple ways to handle errors, but we’ll focus on the simplest approach.
Configuring the HTTP Request Node to Handle Errors
Double-click the HTTP Request node to open its settings.
Navigate to the Settings tab.
Find the On Error dropdown and change it from "Stop Workflow" to "Continue (using error output)".
Why are we doing this?
By default, if the request fails (e.g., the website is down), n8n stops the entire workflow. But we don’t want that - we want to detect the failure and take action.
By selecting "Continue (using error output)", the node will still send an output when it fails, but through a separate error output path. This allows us to handle failures without breaking the workflow.

You should be on this screen:
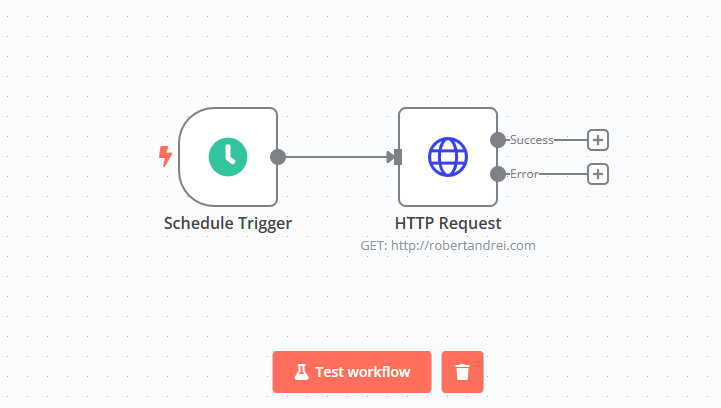
Let’s test it, click on the “Test Workflow” button.
Testing the Workflow

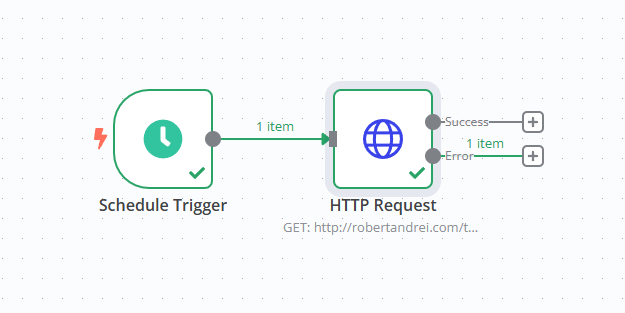
This image shows the workflow in action after clicking "Test Workflow". Here’s what’s happening:
The Schedule Trigger successfully ran (✅ green checkmark) and sent 1 item to the HTTP Request node.
The HTTP Request node also completed successfully (✅ green checkmark) and returned 1 item.
The node outputs show two possible paths:
Success (Top Output) – Used when the request was successful (e.g., the website is up).
Error (Bottom Output) – Used when the request fails (e.g., the website is down).
Since the success path has 1 item, it means the website responded normally. If the website were down, the error path would have received an item instead.
Next, we’ll connect the error output to the Twilio SMS node so we get notified if the website goes down.
But before we test it, we need to simulate an error—and no, breaking your actual website isn’t the best idea. Instead, we can point the HTTP Request node to a page that we know doesn’t exist.
How to Simulate an Error:

Double-click the HTTP Request node to open its settings.
Modify the URL to something that will return an error, like
https://yourwebsite.com/this-page-does-not-exists/Click Save and then run "Test Workflow" again.
Now, the request should fail, triggering the error output, which we’ll connect to the Twilio SMS node next!
Sending the notification
There are many ways to send notifications—email, SMS, WhatsApp, Telegram, and more. But sticking with our simple approach, we’ll send an SMS using Twilio if something goes wrong with the website.
For the next step, you’ll need a Twilio account. If you don’t have one yet, sign up for their free trial (no payment details required). This will give you access to a test phone number and some free credits to get started.
Once you have your Twilio account we can send an SMS notification when the website is down.
Adding the Twilio SMS Node
Click the plus (+) button on the error output of the HTTP Request node.
In the node selection sidebar, search for "Twilio". Click on Twilio then select “Send an SMS/MMS/WhatsApp message”

This node will send a text message whenever the website is unreachable. Next, we’ll configure it with your Twilio account details!
Click on "Select Credential", then choose "Create New Credential". This will bring up the Twilio account setup screen.

Here, simply enter your Account SID and Auth Token from your Twilio dashboard. You can find them in the bottom left under Account Info.
Once done, click Save. If everything is correct, you’ll see a confirmation that Twilio is now connected.
Configuring the Twilio SMS Node
Now, let’s set up the Twilio SMS node to send an alert when the website is down.
Setting Up the Phone Numbers
In the "From" field, enter your Twilio phone number (you can find this in your Twilio account details).
In the "To" field, enter the phone number where you want to receive the SMS alert.
Understanding the Input Data (Left Panel)
The left panel displays data from the HTTP Request node. Since we tested the workflow with a broken URL, you can see the error details, including:
status: The HTTP status code (404 means "Page Not Found").code: The error type.message: The raw error message returned by the website.
Dragging Variables into the Message Field
First of all, in the Message field of the Twilio node, make sure "Expression" is selected instead of "Fixed". This allows you to dynamically insert data from the error response instead of using static text.
Instead of writing a static message, you can drag and drop values from the input panel into the Message field to customize the SMS. Just click on the data label and drag and drop it where you need it.
For example, in the message field, you can add:
Website is down!!!
Error Code: {{ $json.error.code }}
Error Status: {{ $json.error.status }}
Date: {{ $('Schedule Trigger').item.json['Readable date'] }}
Time: {{ $('Schedule Trigger').item.json['Readable time'] }} 
Final Testing & Going Live
Now it’s time to test your setup and make sure everything is working.
Send a Test SMS
You have two options:
Click "Test Step" in the Twilio SMS node to manually send the message.
Run the entire workflow again to simulate a website failure.
If everything is set up correctly, you should receive an SMS that looks like this:
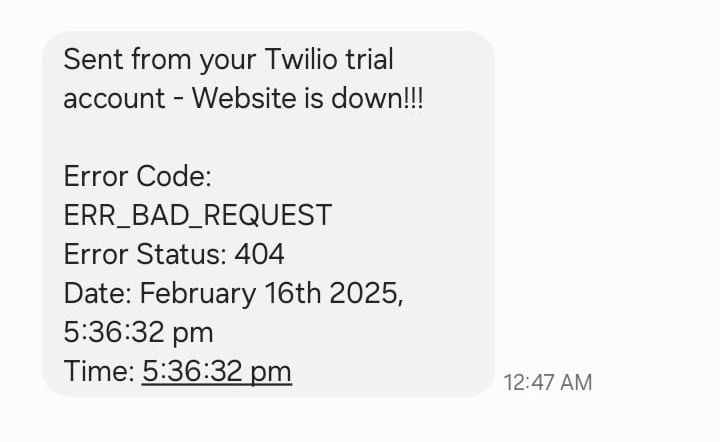
Once you receive the message, you know the workflow is working as expected.
Go Live
Now that everything is tested, it’s time to set the workflow to monitor your real website:
Double-click the HTTP Request node and replace the test URL with the actual website you want to monitor.
Click Save to update the workflow.
Enable the workflow by toggling the switch at the top of the canvas (as shown in the second image).

Once activated, n8n will automatically check your website at the set intervals, and you’ll receive an SMS if there’s an issue.
Congrats! You’ve just built an automated website monitoring system
Wrapping Up
Your website monitoring automation is now live! But before you sit back, it's a good idea to check the Executions tab every now and then to ensure everything is running smoothly. Here, you can see past runs, check for errors, and confirm that the SMS alerts are being sent when needed.
Got questions? Something not working as expected? Drop a comment and let me know - I’d love to help.
Also, I’m always looking for new automation ideas! If there’s something specific you’d like to see covered next, let me know in the comments.
If you found this useful:
✅ Subscribe to the newsletter so you don’t miss future tutorials.
🔄 Restack to share this with others.
❤️ Comment if you enjoyed it—your feedback keeps this series going!
More automations coming soon!
A lot! I use n8n to automate lead collection, sync with my CRM, send follow-ups, and repurpose content etc.
I also use it to monitor websites, track news feeds, and summarize YouTube videos just to name a few.
Right now, I’m building my own deep research system - because I’m not paying $200/month for that.
It saves me a ton of time and keeps everything running smoothly.
What types of automations are you currently running with n8n?